INTRODUCTION
Multivariate statistical methods have been applied for quantitative infrared spectroscopy for one decade [1-9]. Quantitative FT-IR spectroscopy has been greatly improved by the use of a variety of multivariate calibration methods, such as, classical least squares (CLS) or K-matrix, inverse least squares (ILS) or P-matrix, partial least squares (PLS), and, principal component regression (PCR). The PLS technique has been proven to be a reasonable and optimal choice over a wide range of conditions [ 5, 8, 10].
Traditionally, liquid transmission cells or liquid ATR cells have been used for quantitative FT-IR experiments to provide a constant optical path length [4,11]. In this work, sample solutions were deposited on ZnSe plate and evaporated to cast films. The film spectra were collected in transmission mode on an FT-IR microscope with a high sensitivity MCT detector for microanalysis. Therefore, the pathlength is indeterminate for each individual spectrum. Geladi et al [12] described the Multiplicative Scatter Correction (MSC) to the training set to attempt to correct for indeterminate pathlength effects resulting from scattering when using sampling techniques such as diffuse reflectance. MSC is calculated by correcting each training spectrum relative to an “ideal spectrum” which , in their case, is assumed to be the average of the all training spectra in each of the chosen spectral regions. Each spectrum is fit as a linear function of the “ideal spectrum”. This correction normally works well when the concentrations of the components in the samples only vary in a narrow range. Large changes in spectral response and concentration between training spectra will cause error with MSC [8, 13].
In this work, we just normalized each individual spectrum and organized normalized concentrations for each training mixture to correct the indeterminate pathlength effects when using an FT-IR microscope in transmission mode. We performed this correction to the spectral data prior to passing the data to the PLS technique for calibration or for prediction. This approach and experimental method work well if the baseline and suitable spectral regions are considered. The quantitative component ratios are obtained by this method in conjunction with PLS.
EXPERIMENTAL
All monosaccharides and disaccharides were purchased from Sigma Chemical Co. (Louis, MO). The samples were dissolved in water at a concentration of 0.01M. An autoclavable pipette was used to prepare training mixtures with different component ratios. A few microliters of sample solutions were deposited on ZnSe Plate and evaporated to dry films. The films spectra were collected on a Perkin-Elmer (Norwalk, CT) i-series FT-IR microscope / Spectrum 2000 spectrometer in transmission mode. All spectra were obtained from 64 co-added scans at 4 cm-1 resolution and 1 cm-1 data point interval. All spectra have good baselines and maximum absorbance between 0.4 and 1.1 units.
All spectra were transferred to Galactic (Salem, NH) Grams/32 spectral software with PLSplus software package.
RESULTS
AND DISCUSSIONS
1. Normalization of spectra and concentrations of
training sets
Before the spectral data were passed to the PLS for calibration, they were normalized with the equation (1) to correct indeterminate pathlengths, and the normalized concentrations of training mixtures were edited for calibration. Table I shows the examples of normalized concentrations of training sets.
Spectrum(#S) - Min(#S)
Normalized spectrum
=-------------------------------- (1)
Max(#S) - Min(#S)
Table
I.
The Normalized Concentrations of Training Mixtures
_________________________________________________________
Mannose
GlcNAc Galactose
Integral mol ratio
1 1
1
Normalized
conc.
0.3333
0.3333
0.3333
Integral mol ratio 3 2
1
Normalized
conc. 0.5
0.3333
0.1667
_________________________________________________________
*GlcNAc =
N-Acetyl-D-glucosamine
2. Selection of PLS parameters
PLS-1 algorithm was chosen in this work. In PLS-1, a separate set of scores and loading vectors or factors is calculated for each component of interest. In this case, the separate sets of loading vectors are specifically tuned for each component, and therefor, should give more accurate predictions than PLS-2 or PCR [5,8, 10]. One minor disadvantage in using PLS-1 is that the calculations will take more time.
Three processing algorithms, “Mean Centering”, “Variance Scaling”, and “Baseline Correction”, were selected for both calibration and prediction. The spectral regions, 3700 - 2600 cm-1 and 1800 - 600 cm-1 were chosen for all monosaccharide sets. The baseline regions were neglected. Only one region, 1500 - 650 cm-1, was selected for simple disaccharide training set (Melibiose, Cellobiose, and Lactose). Because the spectral characteristics of these three disaccharides are very similar, the PLS calculation should focus on the small region where fine differences among them exist. Figures 1 and 2 show the spectral regions for PLS calculation of one monosaccharide set and one disaccharide set.
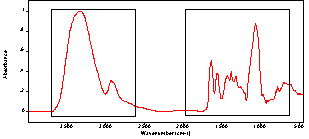
FIGURE 1. IR spectrum of
disaccharide mixture (Mannose : GlcNAc : Galactose=3:6:4). PLS spectral regions
are shown in the rectangles.
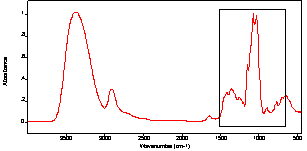
FIGURE 2. IR spectrum of
monosaccharide mixture (Melibiose:Cellobiose:Lactose =2:2:1). PLS spectral
region is shown in the rectangle.
3. Maximum absorbance of training spectra
We have tested two separate training sets of monosaccharides with low absorbance ( 0.4 - 0.7 unit) and high absorbance (0.7 - 1.1 units) and passed them to PLS calculation after normalizing spectra. We have found both low-absorbance and high-absorbance training sets have good corrections between the actual component concentrations and the predicted component concentrations. The square of the correlation coefficient (R2) for each component is about 0.99, indicating a perfect fit. Therefore, at least two spectra with low absorbance and high absorbance for each training mixture were used in the calibration file, if it is possible to locate different sample area with the suitable thickness on the microscope. Table II shows the PLS cross-validation results from 67 spectra of three-component monosaccharide training set (30 samples) with low absorbance and high absorbance together after detecting spectral outliers and concentration outliers.
Table
II.
PLS Cross Validation Results
____________________________________________________
Component RMSD R2
Mannose 0.0083219 0.99885
GlcNAc 0.0071269 0.99681
Galactose 0.0080897 0.99736
____________________________________________________
RMSD = Root Mean square Difference
4. PLS calibration and prediction
Figures 3-5 show the results of PLS calibration for three-component monosaccharide training set. The predicted versus the actual concentrations of this calibration set are plotted in these figures. Highly linear correlation and good agreement between actual and calculated concentrations are demonstrated. The component ratios of unknown mixtures are predicted by this calibration set, shown in Table II and III, which are close to the true values.
The more complex training sets from four to six monosaccharide components have been established and tested. Table IV shows PLS cross-validation results of six-monosaccharide training set, which is calculated from 63 spectra of 30 samples with low absorbance and high absorbance. Table V shows the component ratios of an unknown mixture predicted by this training set.
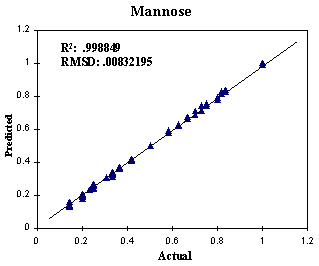
FIGURE 3. Predicted versus actual concentrations of D-Mannose in the three-component training set. Total factors: 31.
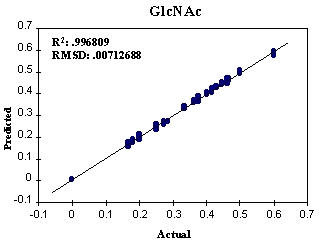
FIGURE 4. Predicted versus
actual concentrations of GlcNAc in the three-component training set. Total
factors: 33.
Table
II.
PLS Prediction of Unknown Mixture
Sample 1
______________________________________________________
Component True
Conc. Predicted Conc. Error%
Int. Norm. “Norm.” “Int.”
Mannose 3 0.5 0.50024 2.998
0.048%
GlcNAc 2 0.3333 0.333
1.996 0%
Galactose 1 0.1667
0.16684 1.00 0.084%
_______________________________________________________
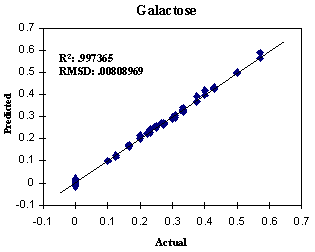
FIGURE 5. Predicted versus
actual concentrations of D-Galactose in the three-component training set. Total
factors: 31.
Table
III.
PLS Prediction of Unknown Mixture
Sample 2
______________________________________________________
Component True
Conc. Predicted Conc. Error%
Int. Norm. “Norm.” “Int.”
Mannose 4 0.4444 0.43874 3.965 1.28%
GlcNAc 3 0.3333 0.34016 3.07 2.05%
Galactose 2 0.2222
0.22131 2.00 0.41%
_______________________________________________________
Int. = Integral, Norm. =
Normalized, Conc. = Concentration.
Table
IV.
PLS Cross Validation Results
_____________________________________________
Component RMSD
R2
Mannose 0.0083182 0.99606
GlcNAc 0.0068592 0.99715
Galactose 0.006955 0.99344
GalNAc 0.0069512 0.99636
NANA 0.0089214 0.9952
Fucose 0.0081615 0.98919
______________________________________________
GalNAc = N-Acetyl-D-galactosamine
Table V. Predicting
unknown mixture
by calibration set in Table IV
__________________________________________________
Component
True Conc.
Predicted Conc.
Int. Norm.
“Norm.” “Int.”
Mannose 3 0.1765
0.18801 3.17
GlcNAc 5 0.2941
0.28842 4.87
Galactose
4 0.2353
0.23591 3.98
GalNAc 2 0.1176
0.11686 1.97
NANA 2 0.1176
0.11304 1.90
Fucose 1 0.0588
0.059284 1.00
___________________________________________________
NANA = N-AcetylNeuramininic Acid
5. The prediction of monosaccharide component ratios by disaccharide calibration set
In order to apply this PLS quantitative approach for complex carbohydrates such as oligosaccharide to analyze monosaccharide ratios, a disaccharide training set was set up to investigate the effects of chemical linkages. Three disaccharides, Melibiose, D-Cellobiose, and b-D-lactose (containing 30% a-D-lactose), were used to organize the standard mixtures. They consist of glucose (Glc) and galactose (Gal). Melibiose is Gala1-6Glc. Cellobiose is Glcb1-4Glc. b-Lactose is Galb1-4Glc. As mentioned in the PLS parameter section, The IR spectra of these three disaccharides are very similar. In order to emphasize and “amplify” the small variation, PLS calculation was focused in the small spectral region, 1500 - 650 cm-1. Table VI shows PLS cross-validation results of the disaccharide training set consisted of 23 mixtures and 45 spectra with both low absorbance and high absorbance after detecting outliers. The square of the correlation coefficient for each component is near 0.999.
Table
VI.
PLS Cross Validation Results of Disaccharide Set
____________________________________________________
Component RMSD(CV) R2
Melibiose 0.00610738 0.999216
Cellobiose 0.00997239 0.997608
Lactose 0.0090237 0.998364
____________________________________________________
In order to obtain monosaccharide component ratios from the disaccharide set, we reorganized the calibration file which only contains two monosaccharide components, glucose (Glc) and galactose (Gal). The predicted versus the actual concentrations in monosaccharide format are plotted in Fig. 6 and 7. They still have a good correlation, indicating that the monosaccharide unit can be discriminated and analyzed among disaccharides by PLS technique. It was noted that R2 , RMSD, and optimal factor or loading vector are identical for both glucose component and galactose component because the spectral and concentration errors were redistributed over both of components when reorganizing the monosaccharide calibration file from the disaccharide set.
CONCLUSIONS
The normalization approaches are proposed for the correction of indeterminate pathlength relative to quantitative FT-IR spectroscopy. Only a few microliters of sample solution is needed to produce a spectrum when using an FT-IR microscope with MCT detector. The amount of samples is decreased to a large extent for FT-IR quantitative analysis.
This quantitative FT-IR approach can potentially be extended to analyze monosaccharide ratios in complex carbohydrates. A chemometric approach to carbohydrate compositional analysis is much simpler and less time-consuming than current techniques such as GC, HPLC, and GC/MS, in which hydrolysis, derivation, and separation are required [14-16].
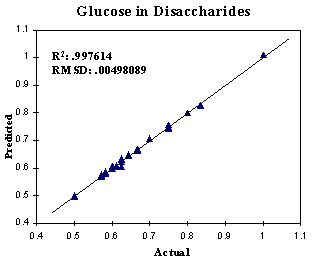
FIGURE 6. Predicted versus
actual concentrations of glucose component in the disaccharide training set.
Total factors: 20.
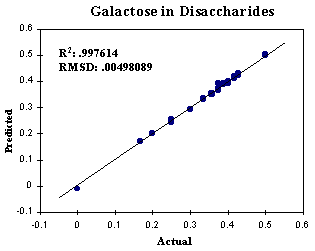
FIGURE 7. Predicted versus actual concentrations of galactose component in the disaccharide training set. Total factors: 20
REFERENCES
1.
Brown, C. W., and Lynch, P. F., Anal. Chem. 54, 1472-1479 (1982).
2.
Haaland, D. M., Easterling, R. G., Vopicka, D. A., Appl. Spectrosc. 39, 73-84 (1985).
3.
Fredericks, P. M., Lee, J. B. Osborn, P. R., Swinkels, D. A. J., Appl.
Spectrosc. 39, 303-310 (1985).
4.
Cahn, F., and Compton, S., Appl. Spectrosc. 42, 865-872 (1988).
5.
Haaland, D. M., and Thomas, E. V., Anal. Chem. 60, 1193-1202 and
1202-1208 (1988).
6.
Haaland, D. M., Anal. Chem. 60,
1208-1217 (1988).
7.
Donahue, S. M., Brown, C. W., Caputo, B. Modell, M. D., Anal. Chem. 60, 1873-1878 (1988).
8.
Fuller, M. P., Ritter, G. L., Draper, C. S., Appl. Spectrosc. 42, 217-227 (1988).
9.
Seashotz, M. B., Archibald, D. D., Lorber, A., Kowalski, B. R., Appl.
Spectrosc. 43, 1067-1072 (1989).
10.
Thomas, E. V., and Haaland, D. M., Anal. Chem. 62, 1091-1099 (1990).
11.
Kemsley, E. K., Zhuo, L., Hammouri, M. K., Wilson, R. H., Food Chem. 44, 299-304 (1992).
12.
Geladi, P., MacDougall, D., Martens, H., Appl. Spectrosc. 39, 491-500 (1985).
13.
Galactic Industries Co. Salem, NH, PLSplus Manual
14.
Chaplin M. F. and J. F. Kennedy, Carbohydrate
Analysis, A Practical Approach, IRL Press, 1994.
15.
El Rassi, Z., Carbohydrate
Analysis, High Performance Liquid Chromatography and Capillary Electrophoresis, Elsevier Press, 1995.
16.
Herderich, M., and Schreier, P., Phytochemical Analysis 4, 256-260 (1993).